
Give Spec Kit Superpowers
Go beyond the markdown files and take control of your spec-driven workflow: one page per run, review the agent applies in place, and a pipeline you can bend.
Spec-driven development is the habit of making the AI agent write down what it's going to build before it builds it. GitHub's Spec Kit is the tool a lot of people use for that: one command per phase, specify, plan, tasks, implement, and each phase lands as a markdown file in your repo.
If you've run a feature or two through it, you know the part that's hard to hold in your head. Here's what a single run leaves behind, phase by phase, with the side commands you can call in between.
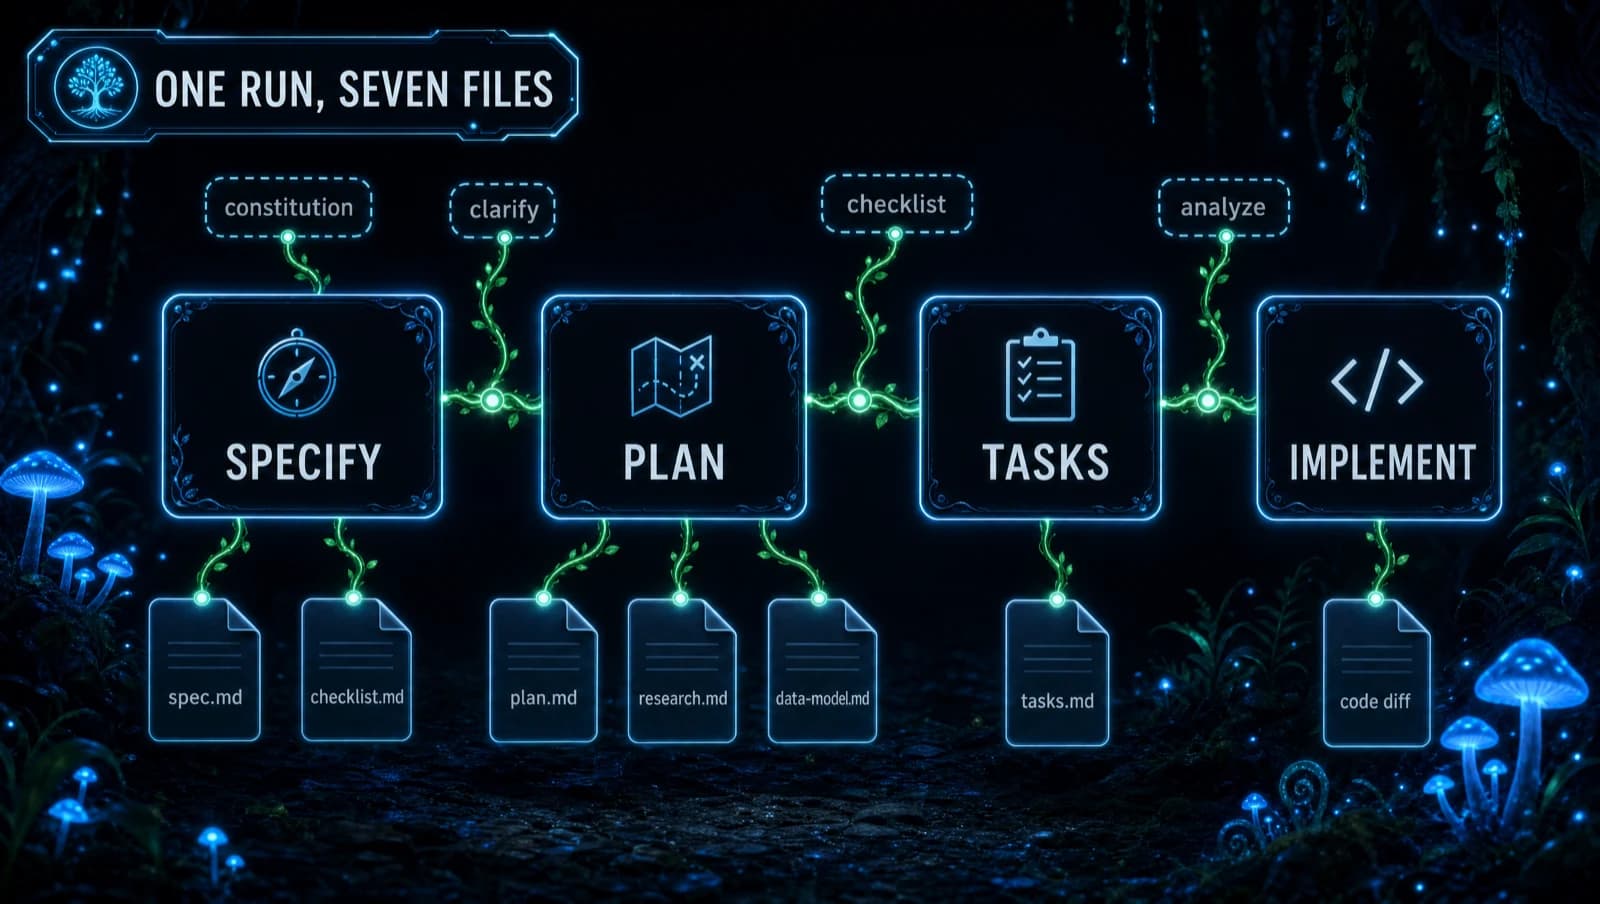
When it finishes, you're the one who has to work out which of those files says what actually happened. The files are all there, but nothing puts them together for you.
Kiro showed that putting the specs in a panel beside the code, instead of in a folder you open by hand, makes the whole thing easier to follow.
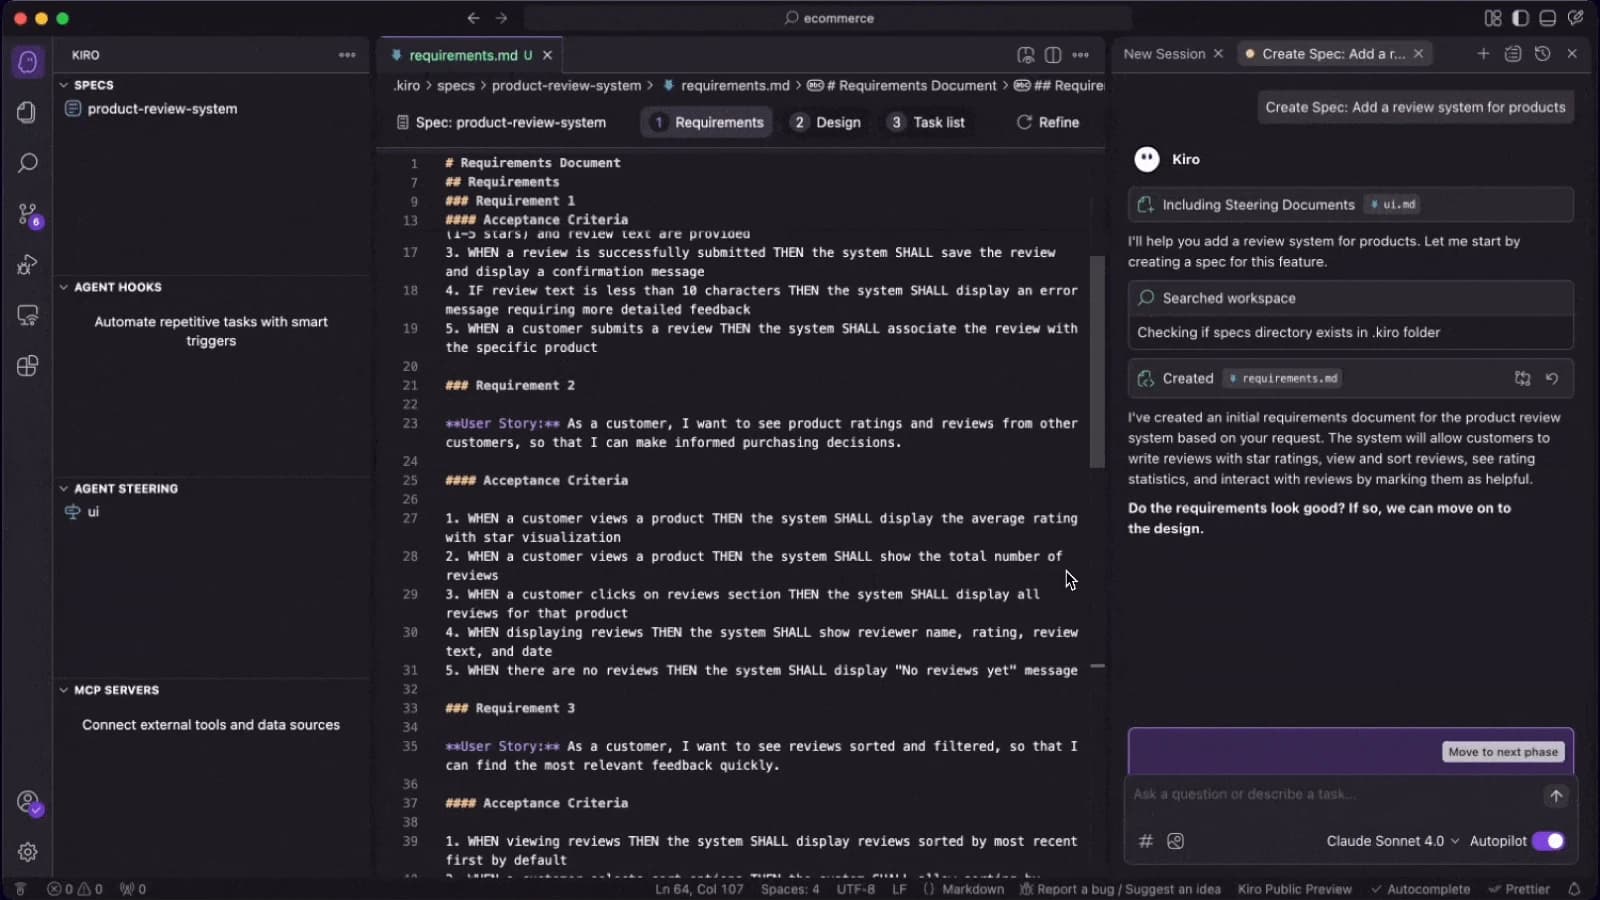
Spec Kit deserves the same, and that's what SpecKit Companion is. It's a VS Code extension that reads what Spec Kit writes and turns it into one page per spec: what the run was for, what it checked, what it decided, and what's left. It also changes the run itself, with a shorter pipeline for small changes, specs that stay current after a feature ships, and a pipeline you can rearrange.
The files never stop being markdown, and that's what makes this work: the agent creates and edits them fast because they're plain text, and Companion is a better way to read the same files.
Install both halves
Companion comes in two parts, and it helps to know which is which before you install. The VS Code extension is the part you look at. The spec-kit extension installs into Spec Kit itself and runs on the command line: it records the run, sizes the pipeline to the change, and keeps living specs up to date. The VS Code side reads what the command-line side writes to a plain .spec-context.json in each spec folder. Neither needs the other, but the tour below assumes both.
The VS Code extension comes from the Marketplace: search for SpecKit Companion in VS Code and install it. The spec-kit extension is a separate step, and it's the one that turns on traceability, fast mode, auto mode, living specs, and custom workflows.
specify extension add companion --from https://github.com/alfredoperez/speckit-companion/releases/download/companion-latest/companion.zip --force
Spec Kit asks you to confirm before it installs from a URL instead of its catalog, so answer y at the prompt. Here's what both halves look like once they're in.
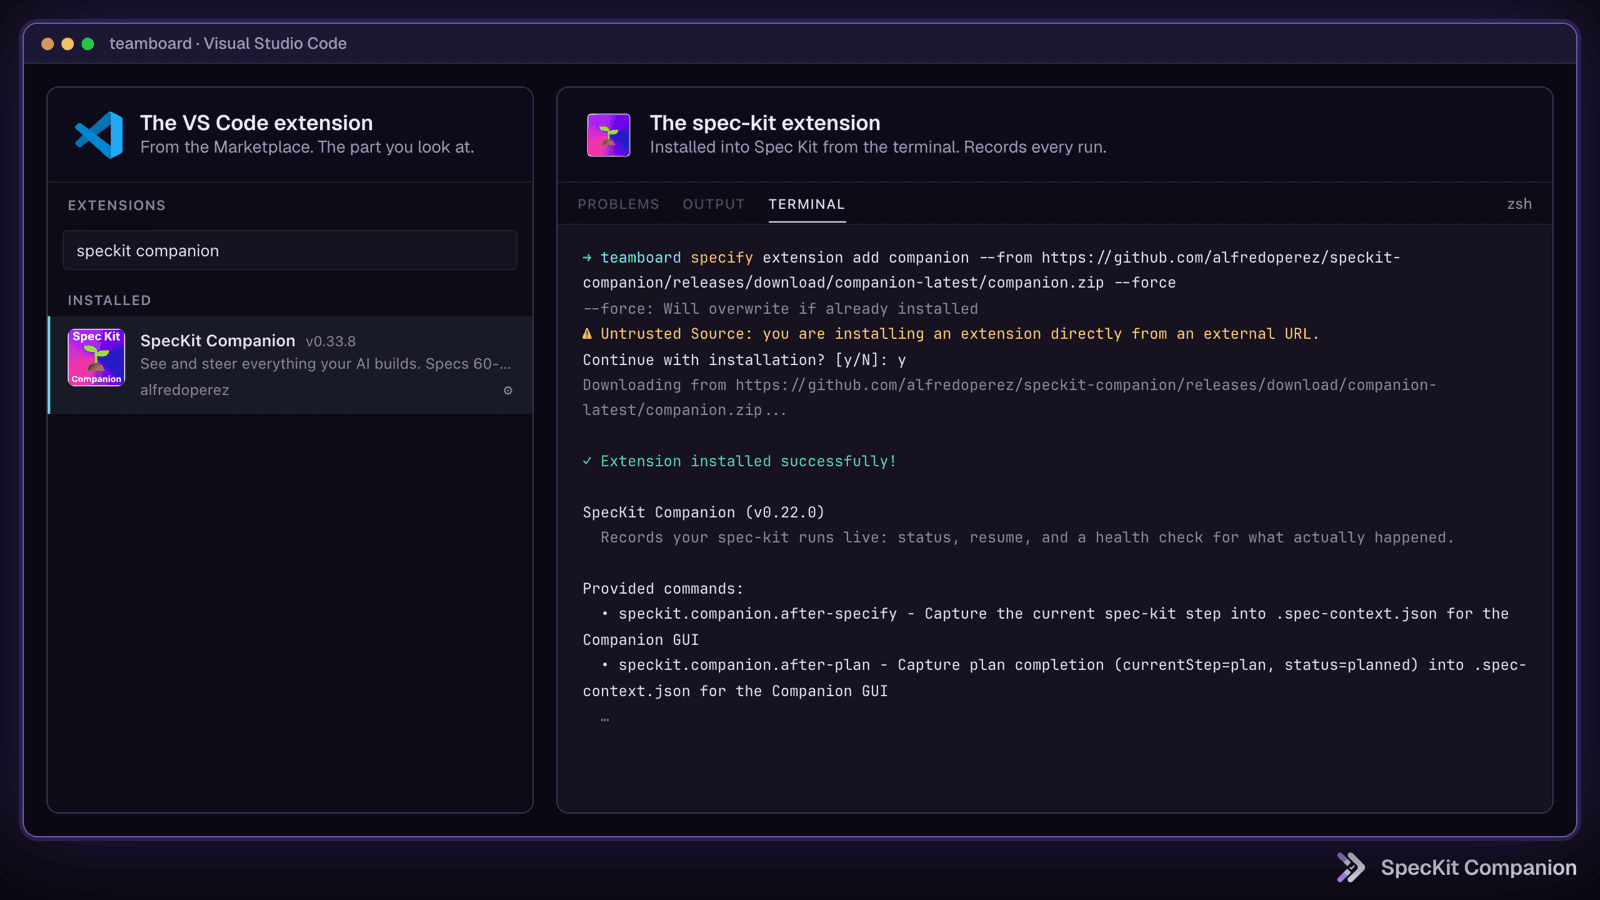
Open a repo that already has a .specify folder and the sidebar fills in.
Start on the Overview
The first thing Companion gives you is the Overview. Every spec with recorded activity gets one page that says what the run was for and what it actually did, and that's where the spec opens.
Here's why it matters. A run in stock Spec Kit produces seven artifacts across four phases. To know whether any of it happened the way you intended, you read all of them, and in practice nobody does.
I'll use one finished spec, a profile photo upload, for every screenshot below, so you're never decoding a new feature between sections. Here is what the page holds, top to bottom, and why each part earned its place.
Why the spec exists, and how the run went
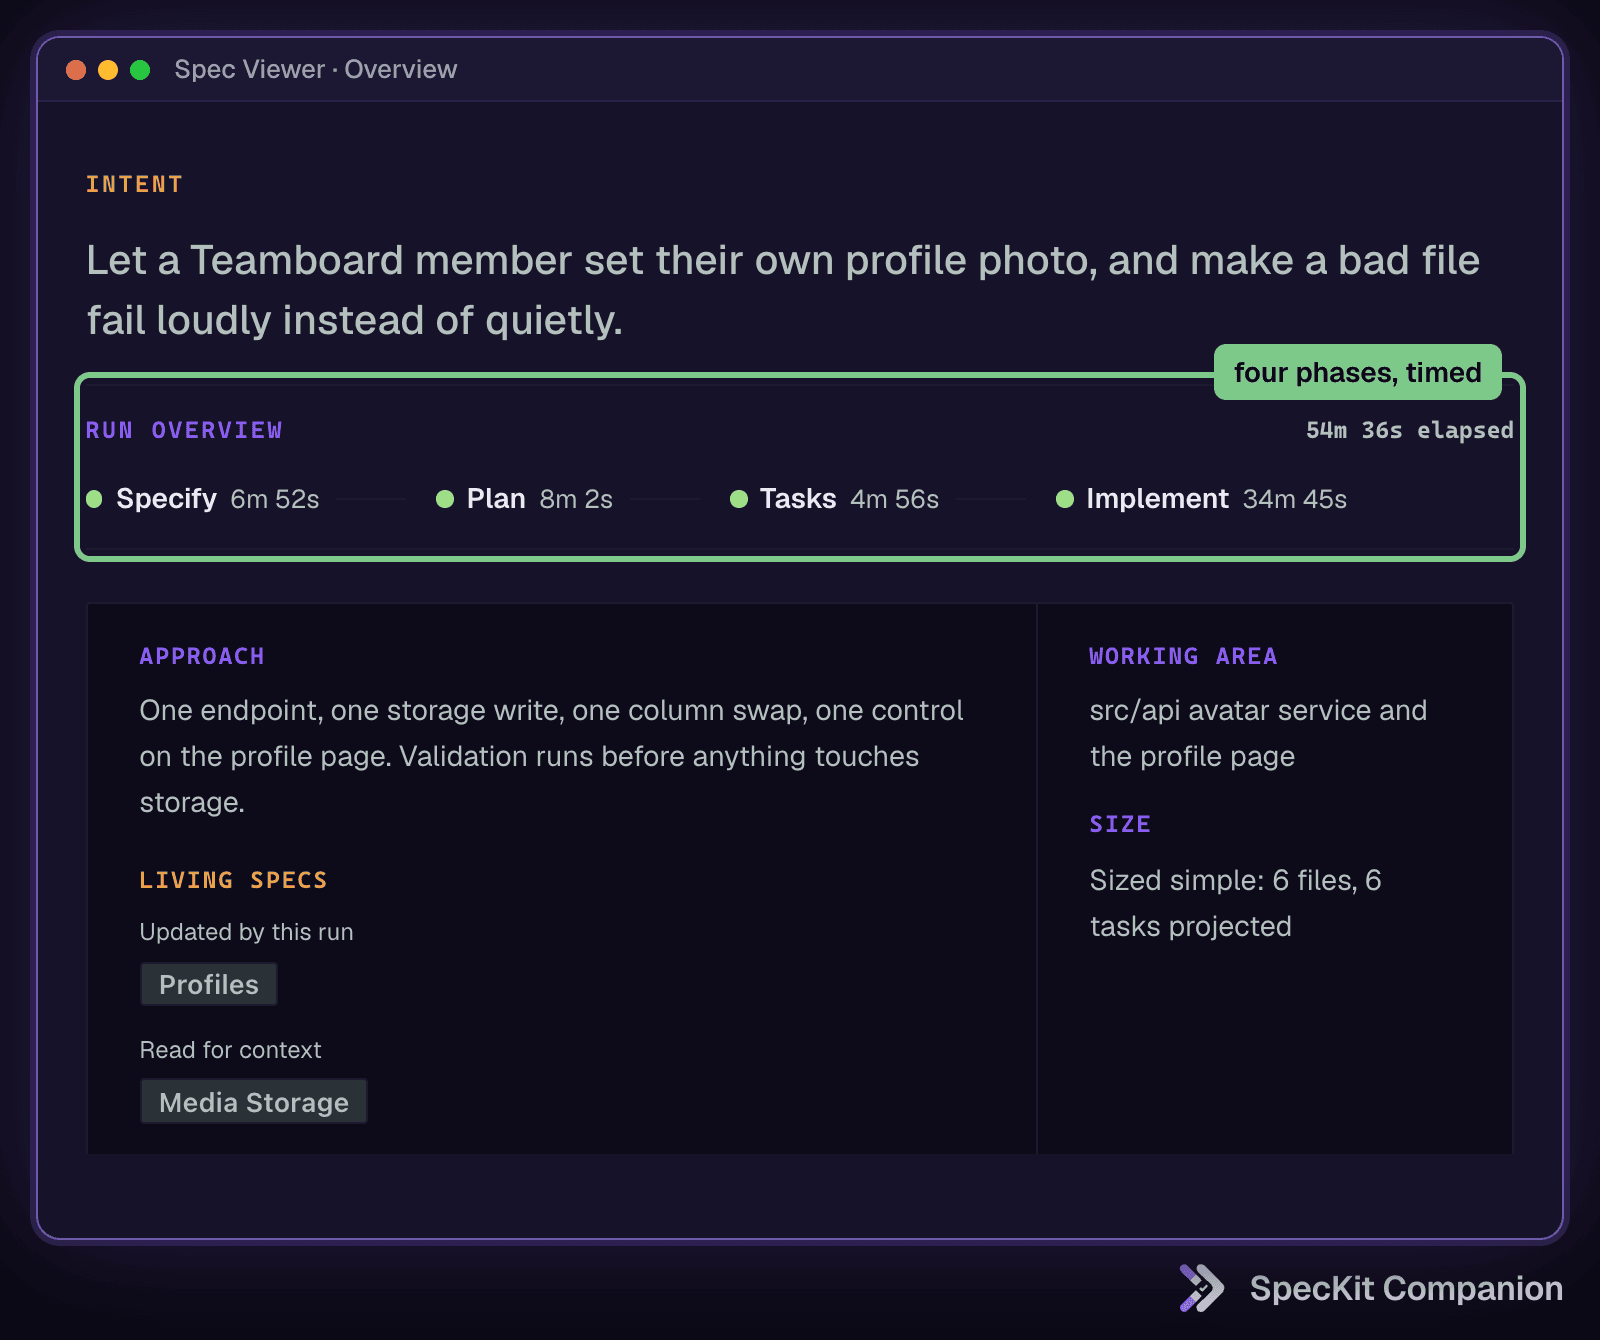
The first thing you read is the reason the spec exists, written as a sentence rather than a feature name. Under it sits the run rail with the four phases, how long each took, and the total, and then a card with the approach in two lines, the area of the codebase it worked in, the size verdict that decided how much pipeline it got, and the living specs it loaded and folded back into.
This block is the answer to "what is this spec and is it relevant to me". When I come back months later, that's the whole question, and it takes a few seconds here instead of four files.
The fence around the work
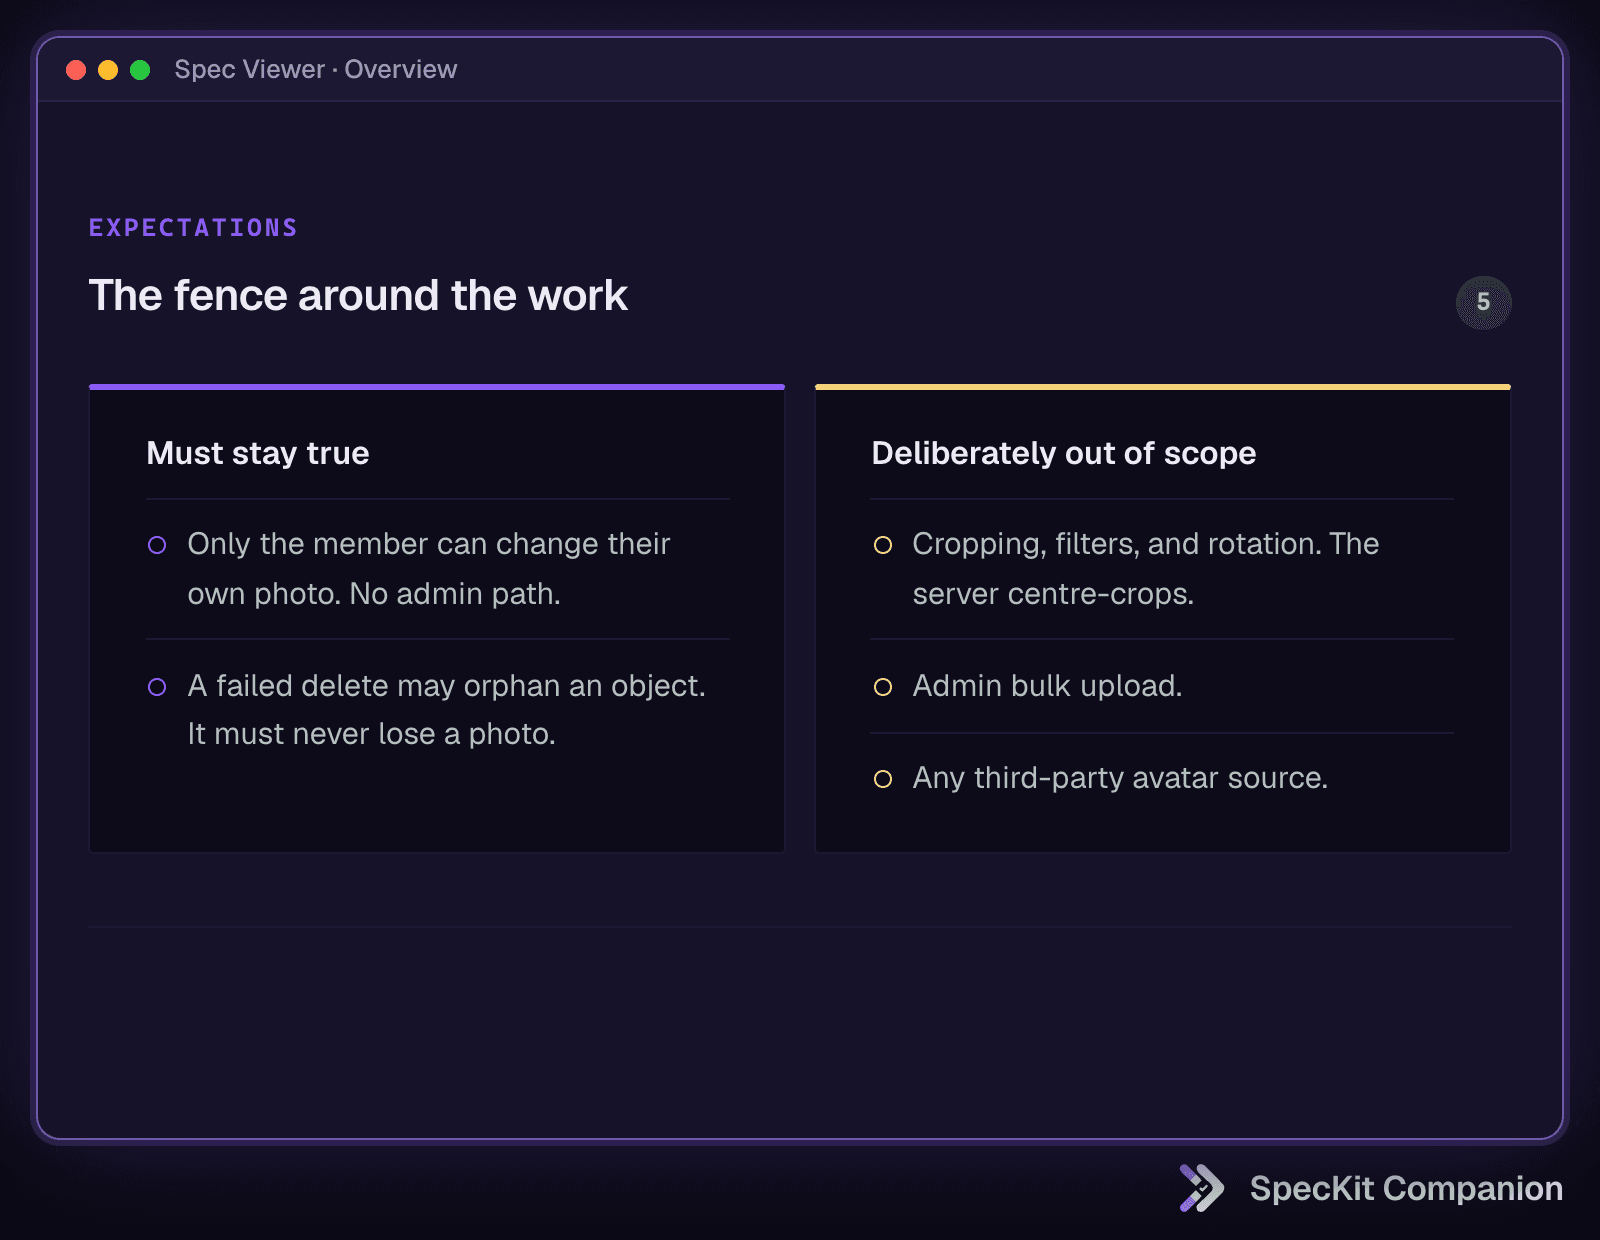
This part is two lists: what must stay true no matter how the feature is built, and what was deliberately put out of scope. The second list is the one that saves arguments later. When someone asks why the uploader doesn't crop, the answer is on the page, dated, and it was a choice.
What was checked, and what happened
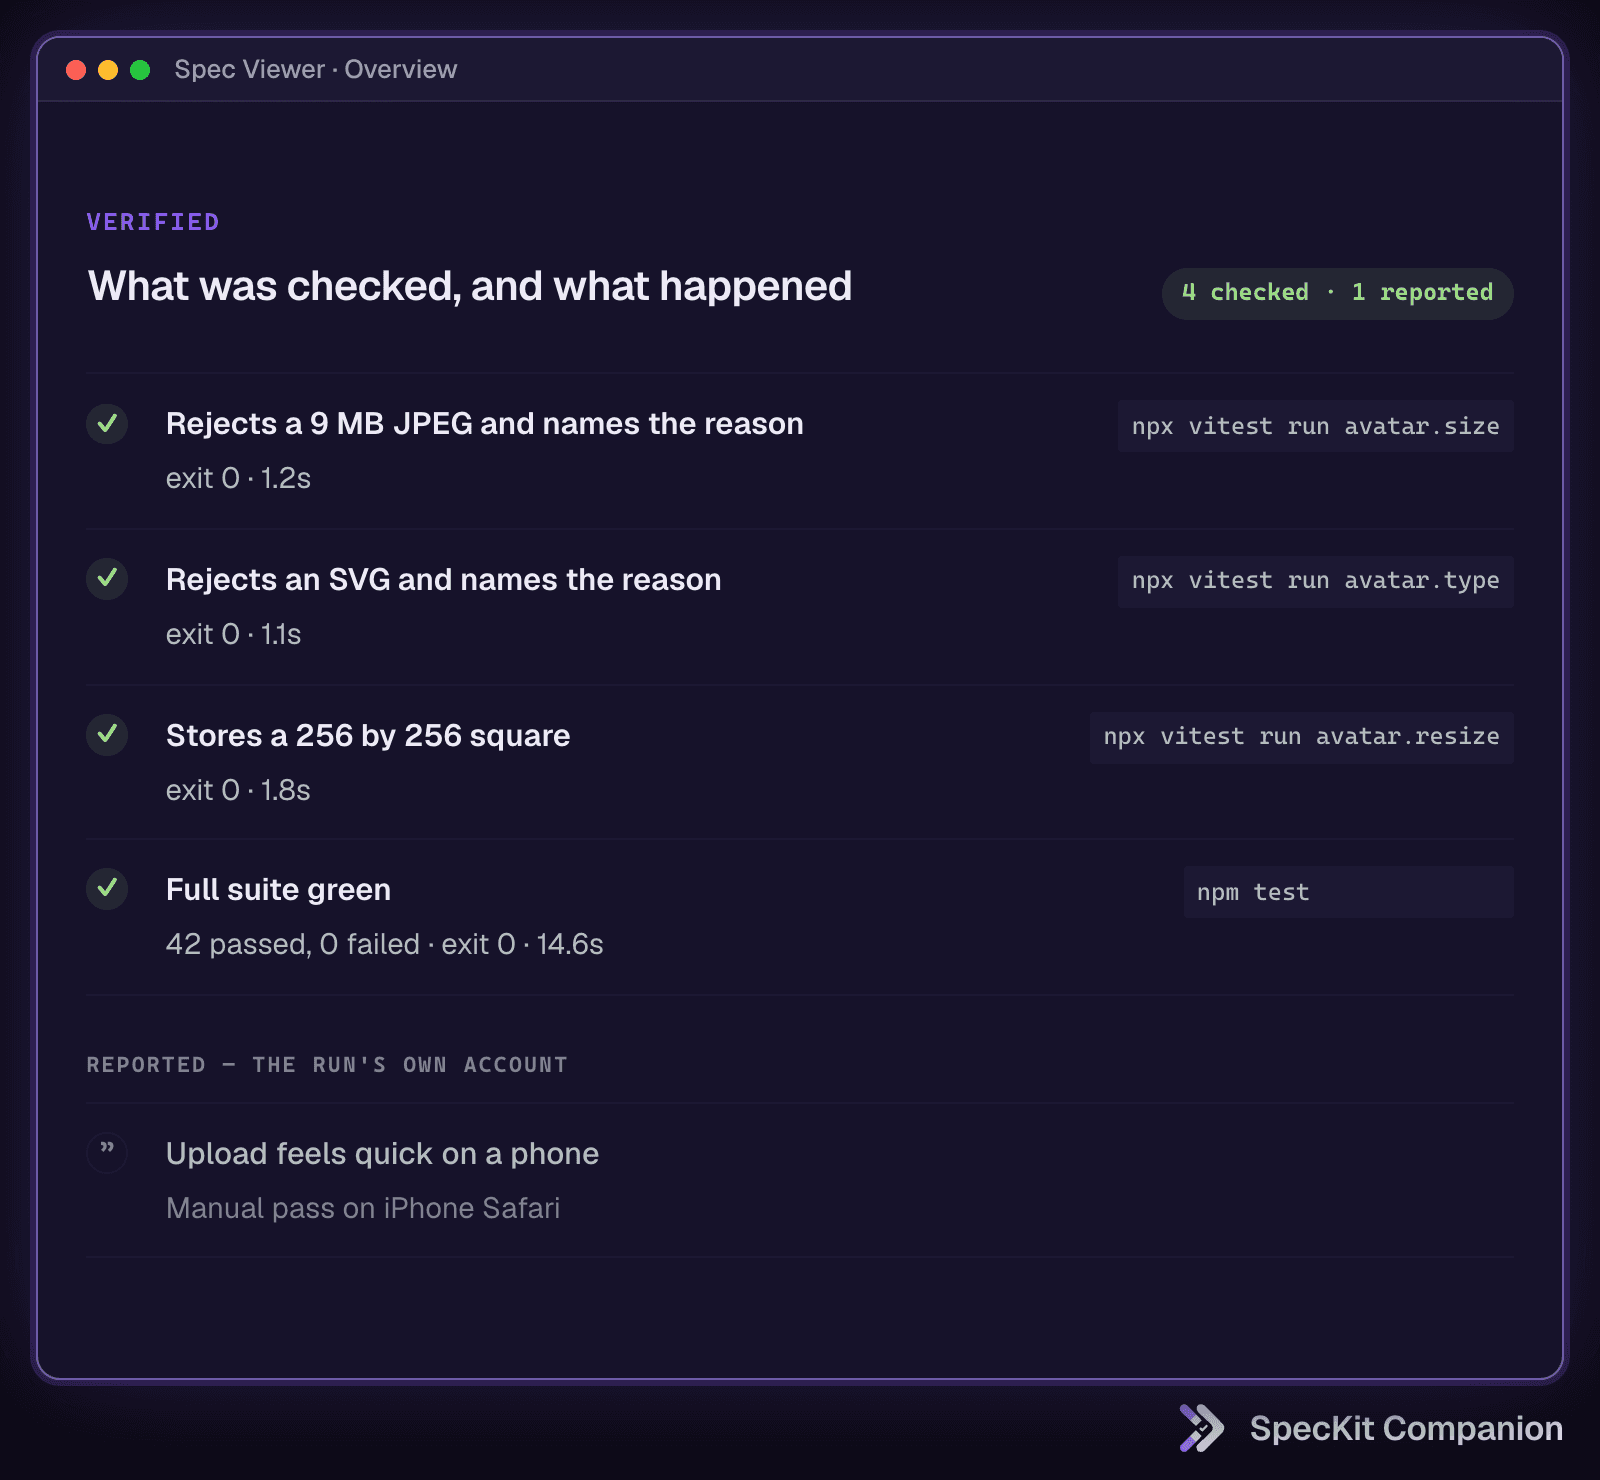
This is every check the run made, split in two. On top are the checks the pipeline ran itself: the command, the exit code, and how long it took. Below them is anything the run only reported, like a manual pass on a phone, shown quieter so it can't pass for proof. If a check failed, it sits here with its exit code, not buried in a terminal scrollback that closed with the session.
This is the part I trust most. A spec can describe anything, and so can an agent summarizing its own work. A row with an exit code is harder to be wrong about.
Choices future work should not have to rediscover
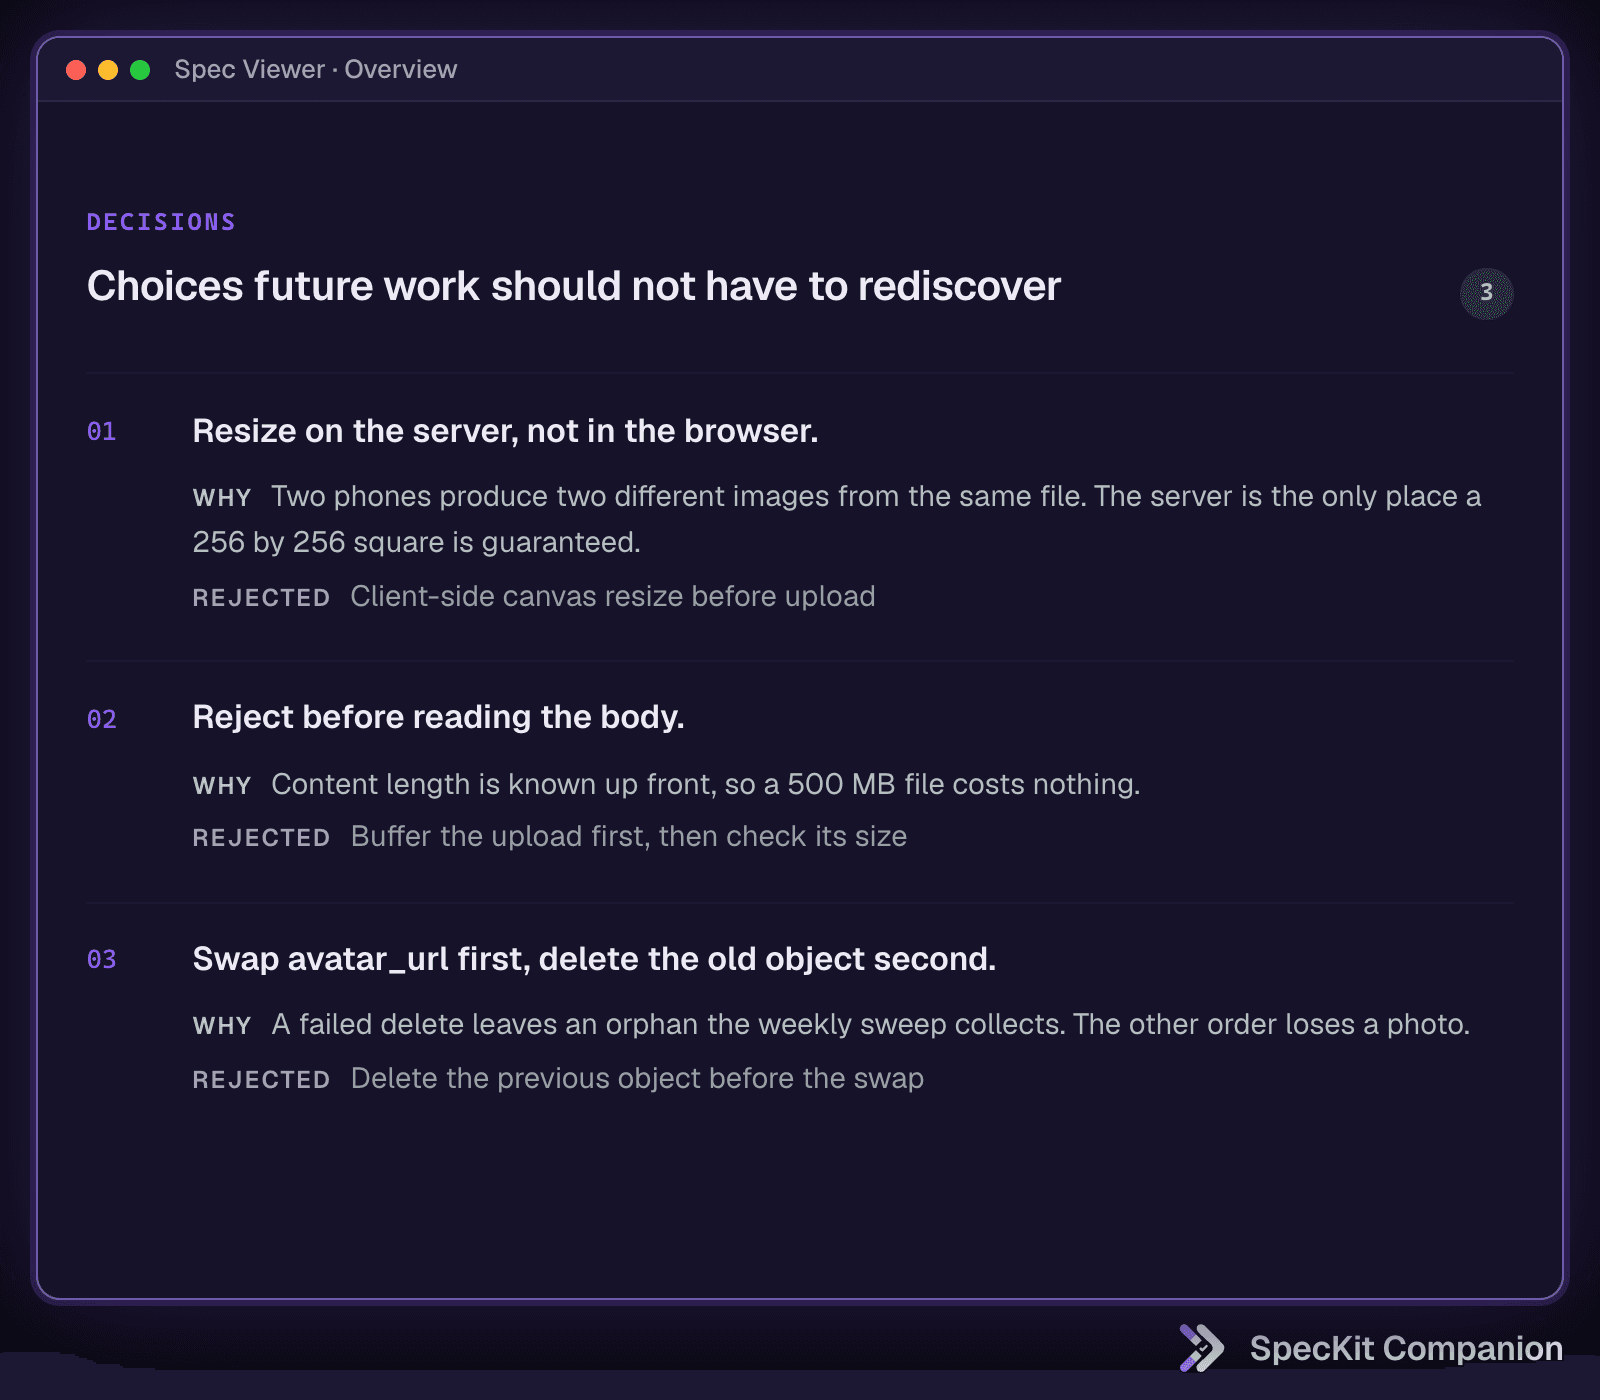
The rejected alternatives are more important than they sound. A decision alone tells you what was decided. A decision with what it rejected tells you the consequences were considered, and it stops the next person, or the next agent, from proposing the rejected option as if it were new.
Requirement to task to test
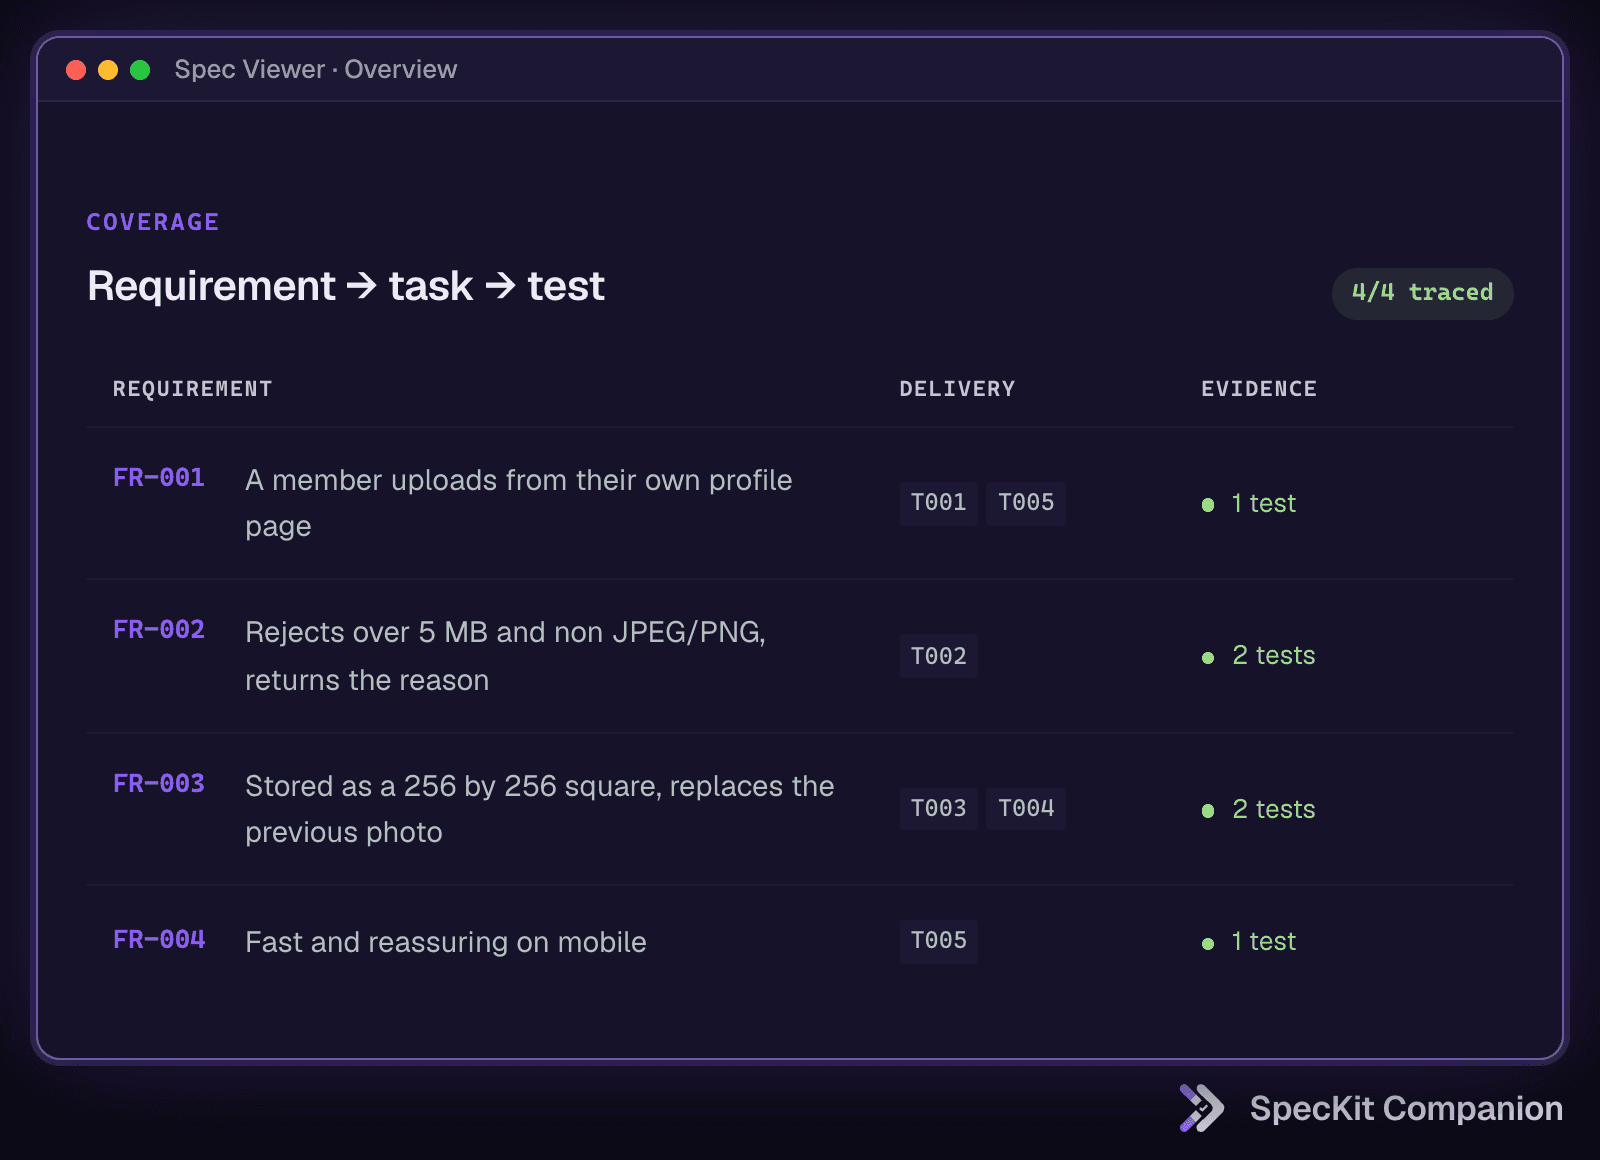
A requirement with no test shows up as a gap, which is the cheapest moment to notice. The run log and the per-task records fold away under it for when you want the blow-by-blow.
And while it runs
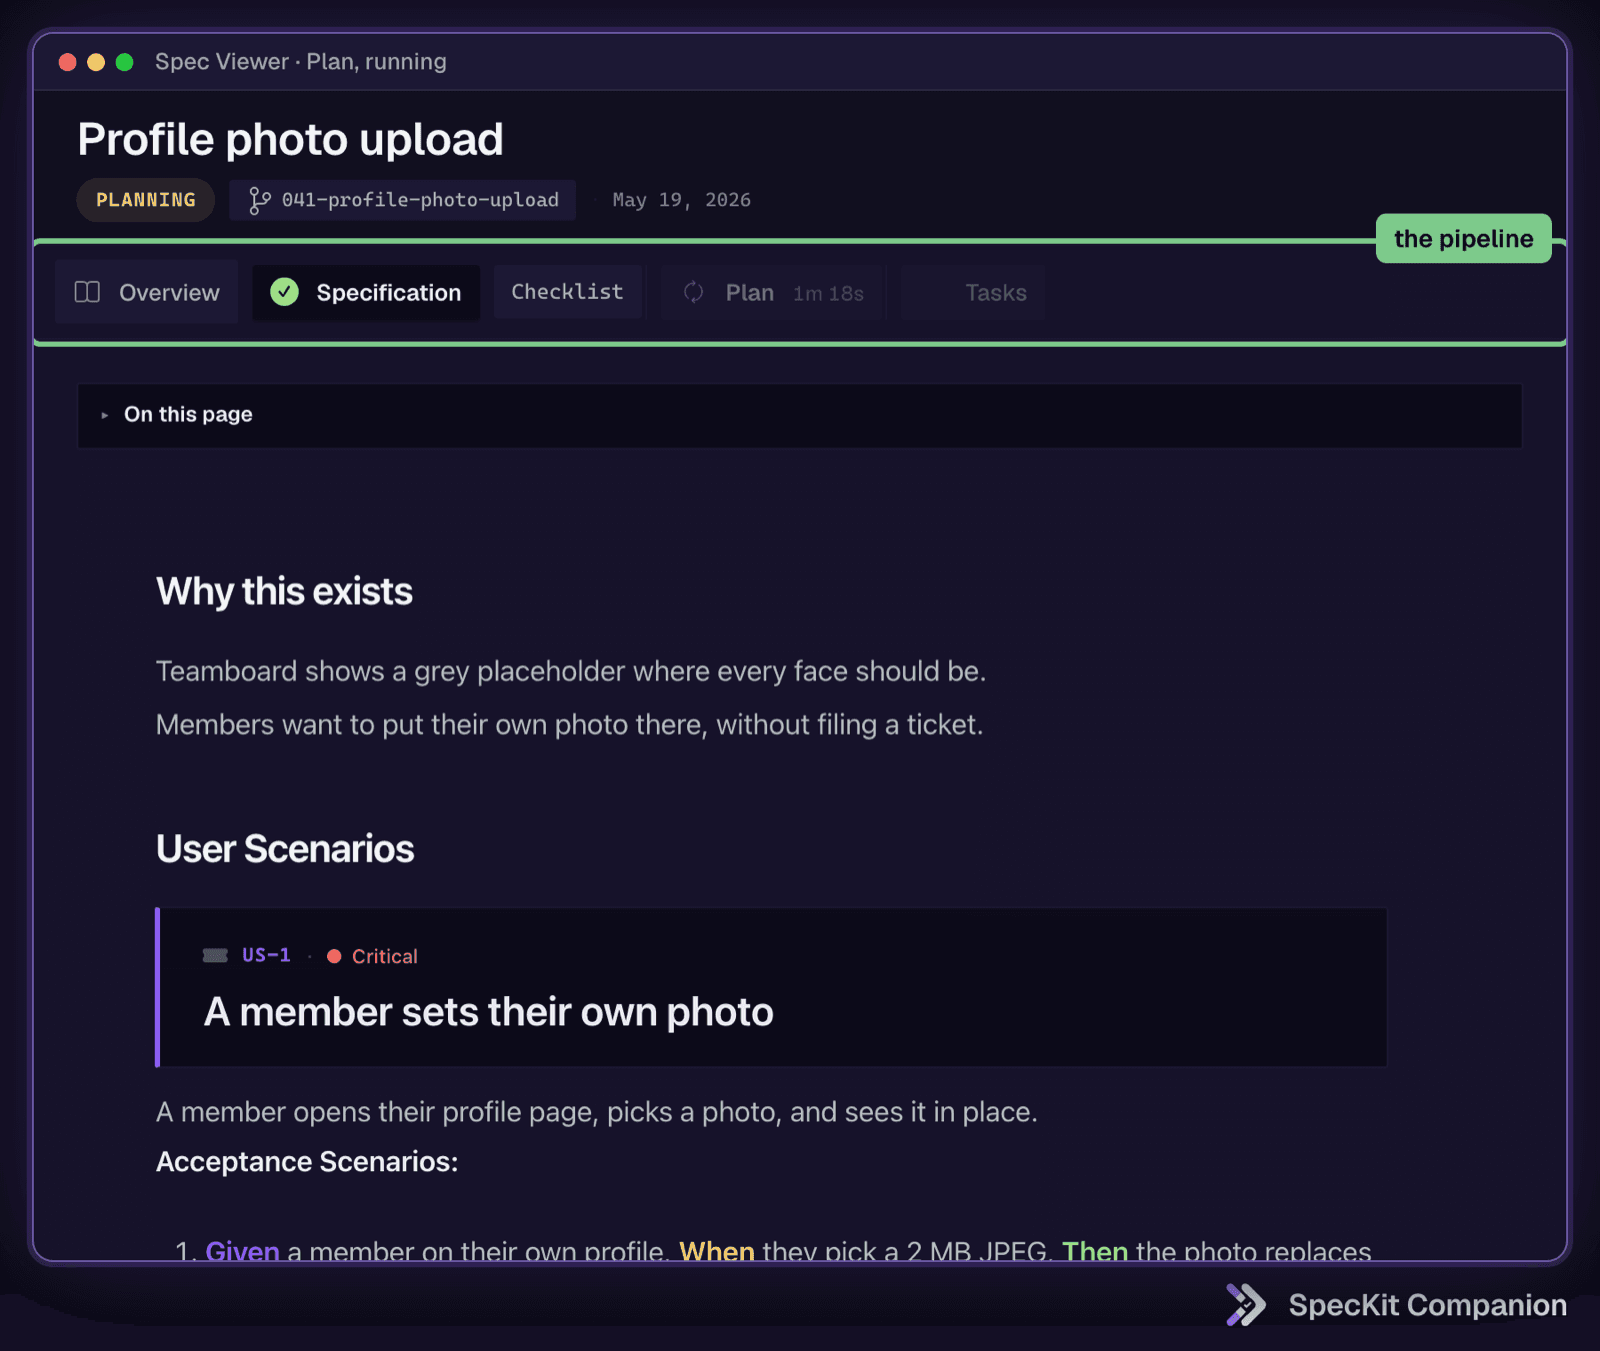
The same spec is what I watch while a run is going. The pipeline across the top unlocks phase by phase, tasks tick over while implement runs, and one button always offers the next step. When it settles, the Overview above is what's left behind.
Read the spec, not the markdown
Click into any artifact and the viewer takes the plain markdown the agent wrote and renders it as something you can scan: user stories become cards, requirements become labeled rows, acceptance scenarios read as Given, When, Then lines, tasks sit under their phase with a badge for their state, and Mermaid diagrams render inline. The file underneath doesn't change. What changes is that you can find the one requirement you care about without reading the ones around it.
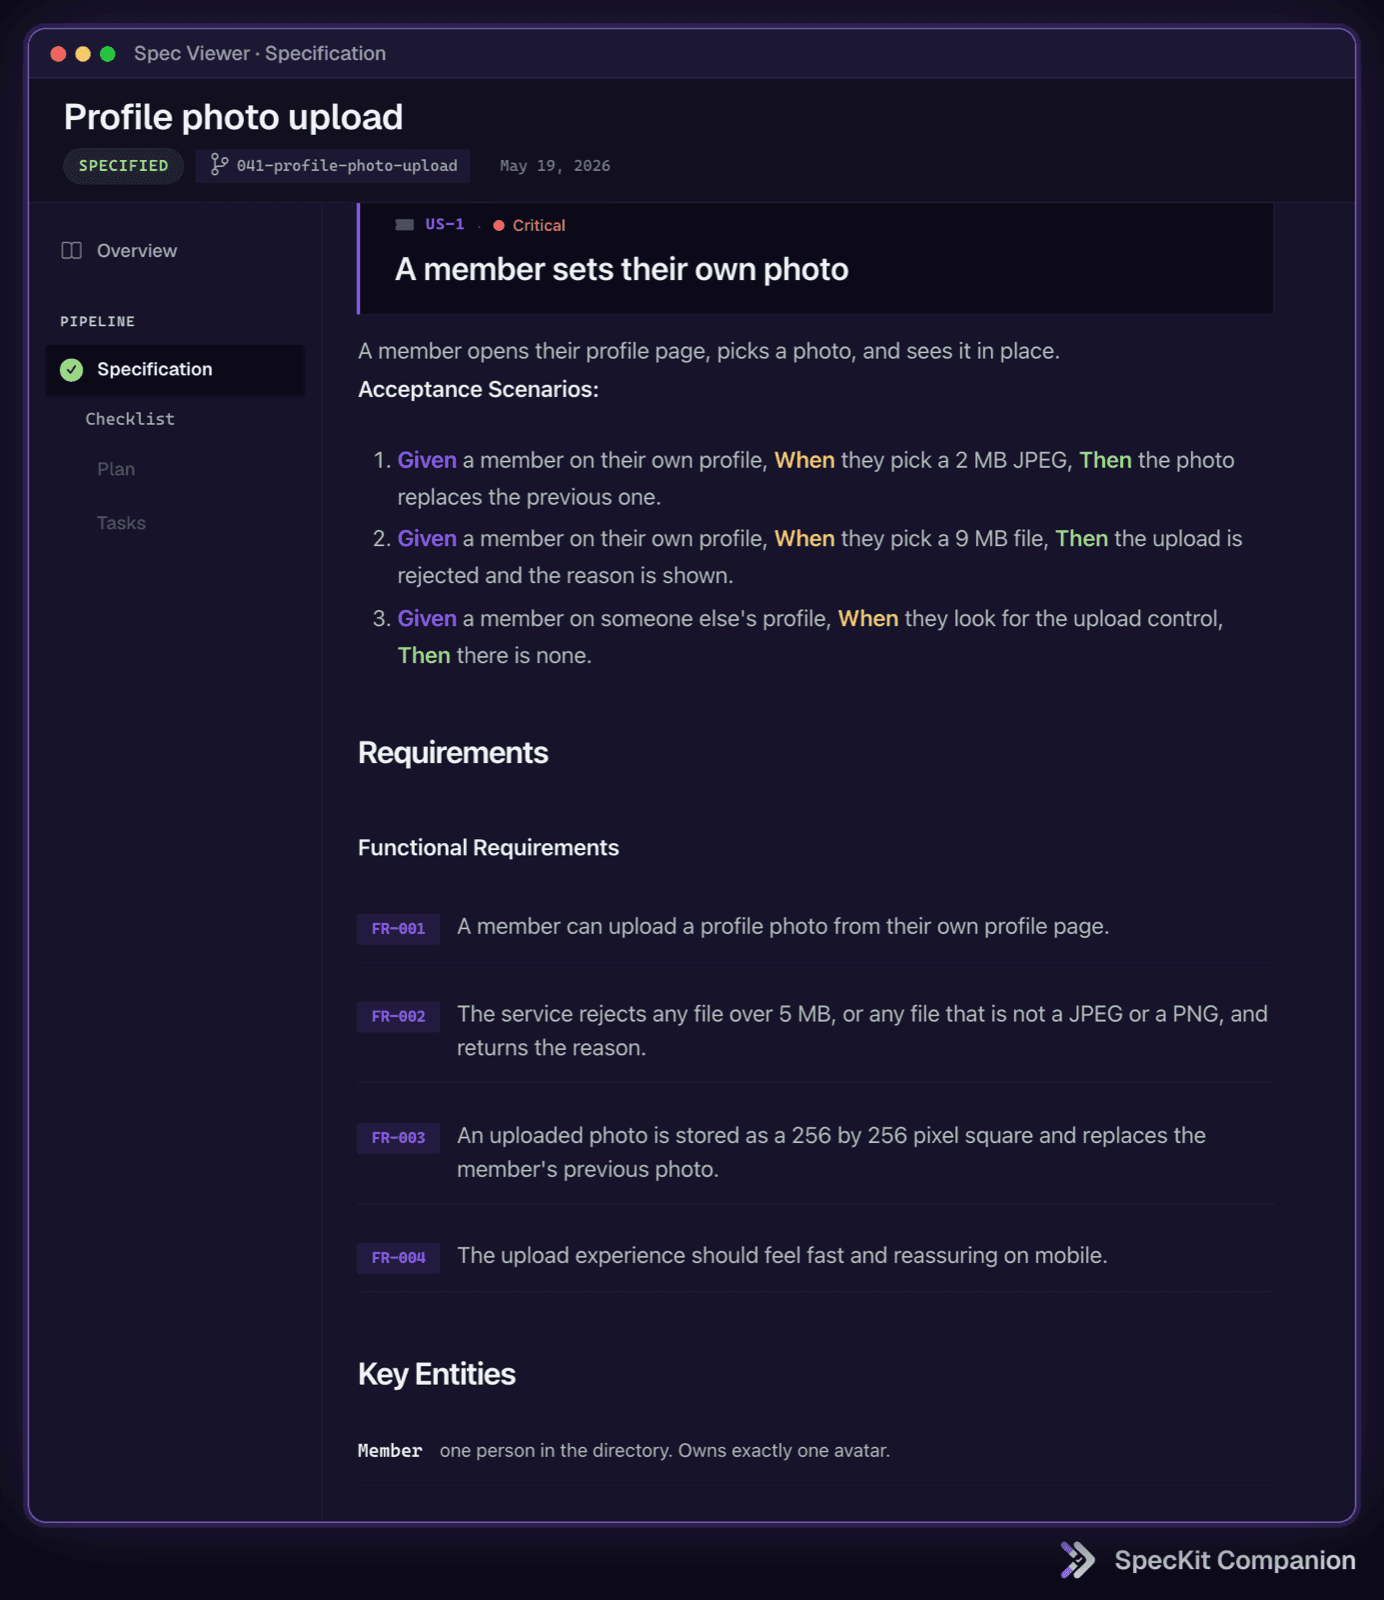
Two things make this more than pretty markdown. The first is that any file the spec mentions is a link. When the plan says the route lives in avatar.ts, you click it and the file opens beside the plan.
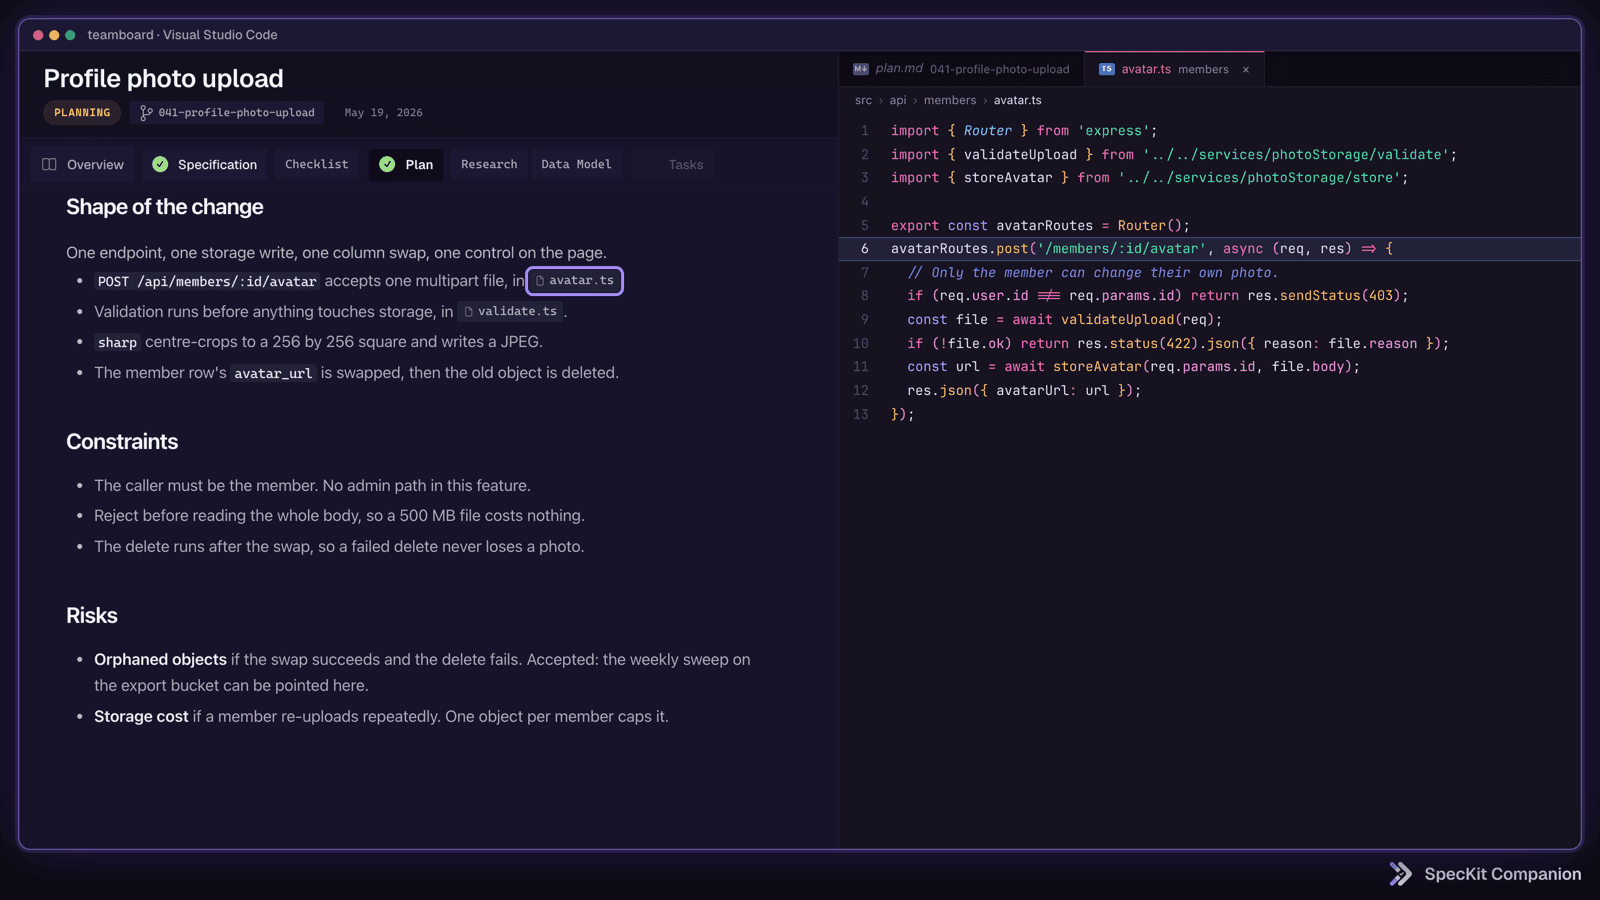
The second is that you're in VS Code, so the spec sits beside the code it describes and the git changes the run produced. With the diff next to it, you read the plan against what actually changed instead of on its own, and that's where a plan that says one thing while the code does another shows up.
Review the spec where it is written
The part I use most is that you can review the artifacts and talk to the spec right there, without going back to the chat to prompt each correction. Every rendered row takes a comment, the way a line in a pull request does.
Here's what those comments usually catch. The agent reads the code near where it's working, picks up a pattern that lives there, and treats it as the house style, when it's often a shortcut someone took in March. The plan proposes a component that's fine for this feature and not reusable for the next one. Or it read a requirement wrong. In the raw markdown those lines look like every other line. In the viewer they're rows you can point at.
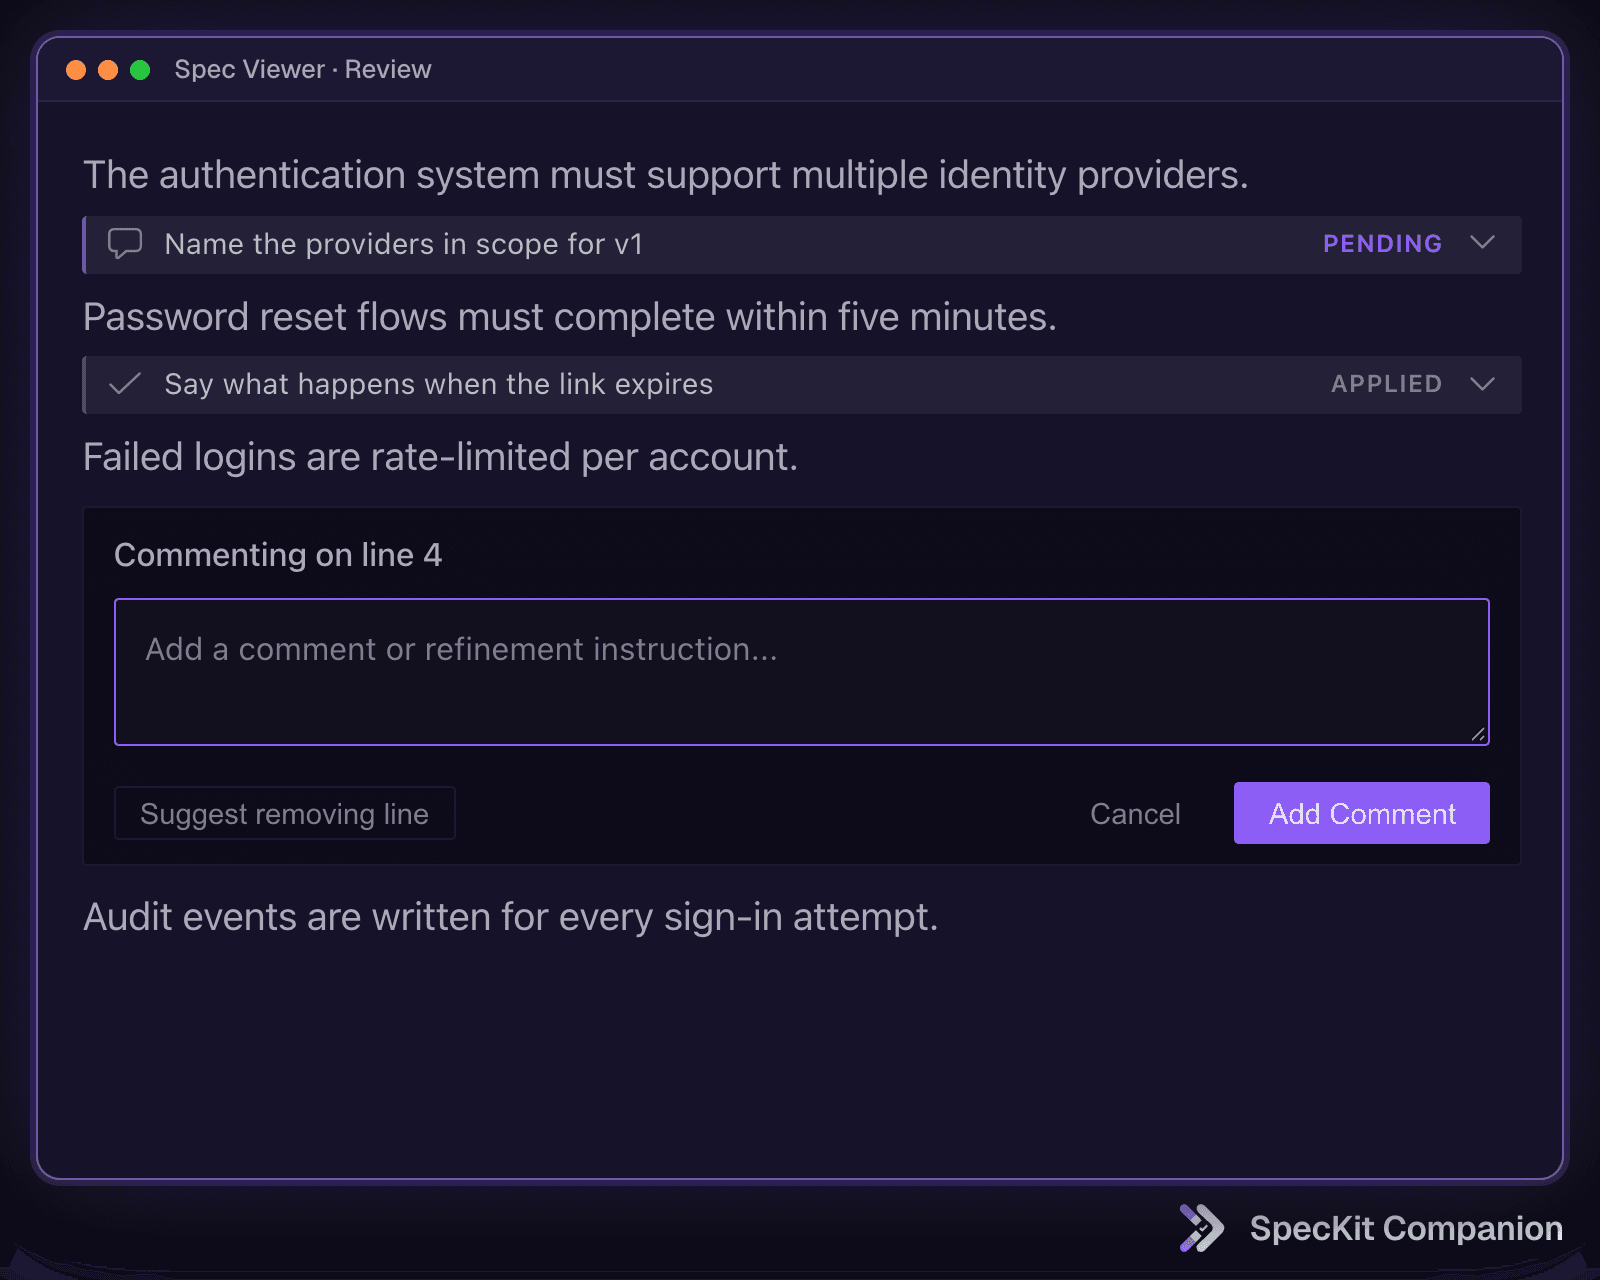
The alternative is what I did first: type the correction into the chat. "The service in the plan, around the middle, should use the shared client, and the component should not be one-off." Then hope the model finds the lines you meant, and fixes both without touching anything else. Two corrections in one prompt is already a coin flip.
I comment on each thing, exactly like a pull request review, then hit Refine once. Here's what the agent receives when I do.
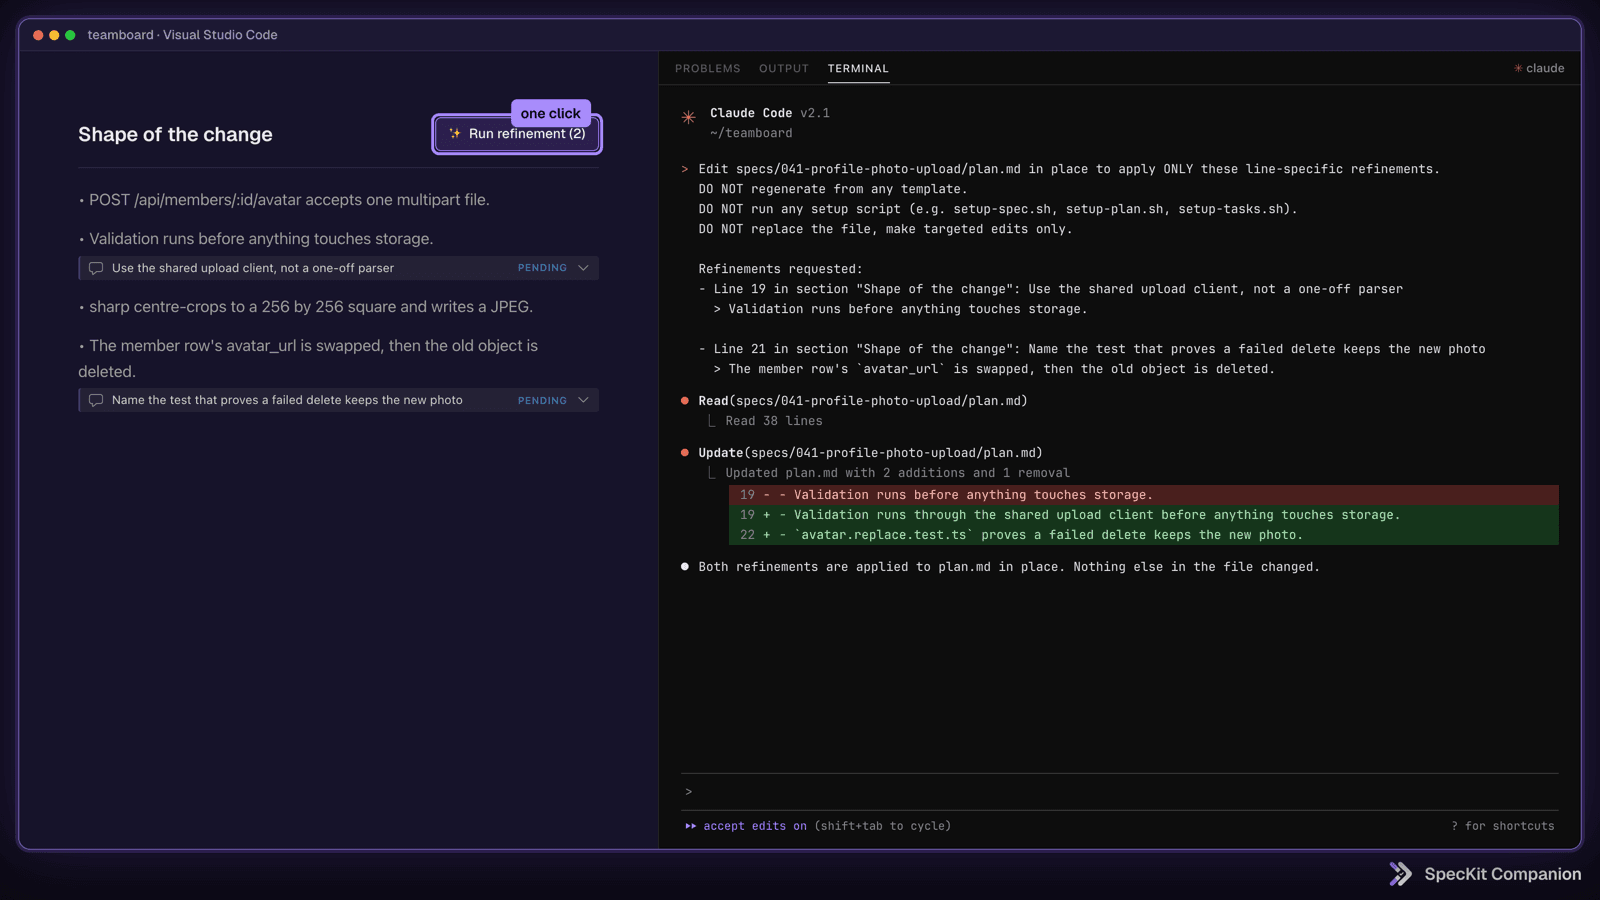
Each comment arrives with the exact line it's about, and the instruction is to edit the file in place rather than regenerate it. The spec comes back corrected, and often with tasks added: a step that applies the pattern I actually want, or a check that keeps the mistake from coming back. The model decides the extent. A one-word comment reworks a sentence, and a paragraph reconsiders the section.
Comments are saved as you type and committed with the repo, so a review you abandon on Friday is still there on Monday, or on the other machine. Some comments never go to the agent at all. They stay as notes for whoever reads the spec next.
Work from the sidebar
The sidebar has three areas, and each one answers a different question.
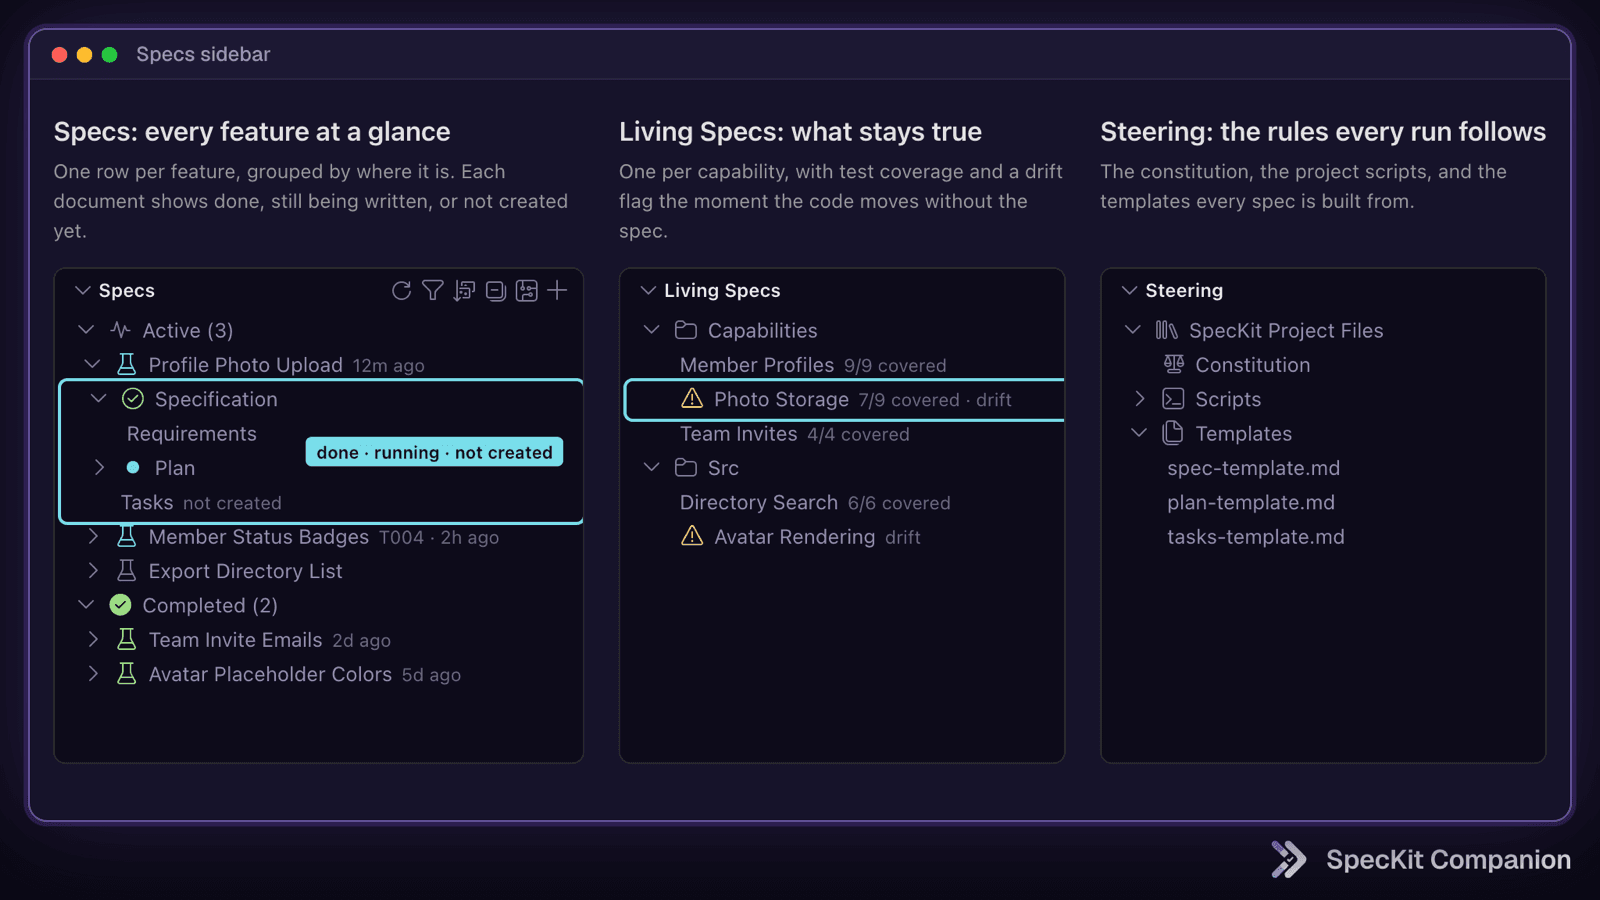
Specs are grouped by lifecycle, with live status per document. You can sort, filter by status, and mark specs complete or archived so only the open ones show.
I don't like working several features at once, so most days that filter shows one or two. What it's built for is the other mode: plan several features, let them run in auto mode, and come back to review all of them from one list. Hover a spec and it offers to resume where it left off.
See what stays true
Feature specs describe one change and then go quiet. Living specs are one per capability, like checkout, auth, or billing. They're loaded into the agent's context when a feature touches that area and brought up to date when the feature ships. I wrote up why in I Wrote 238 Specs and Never Read One Again.
The sidebar's Living Specs area opens each one as a list of requirements.
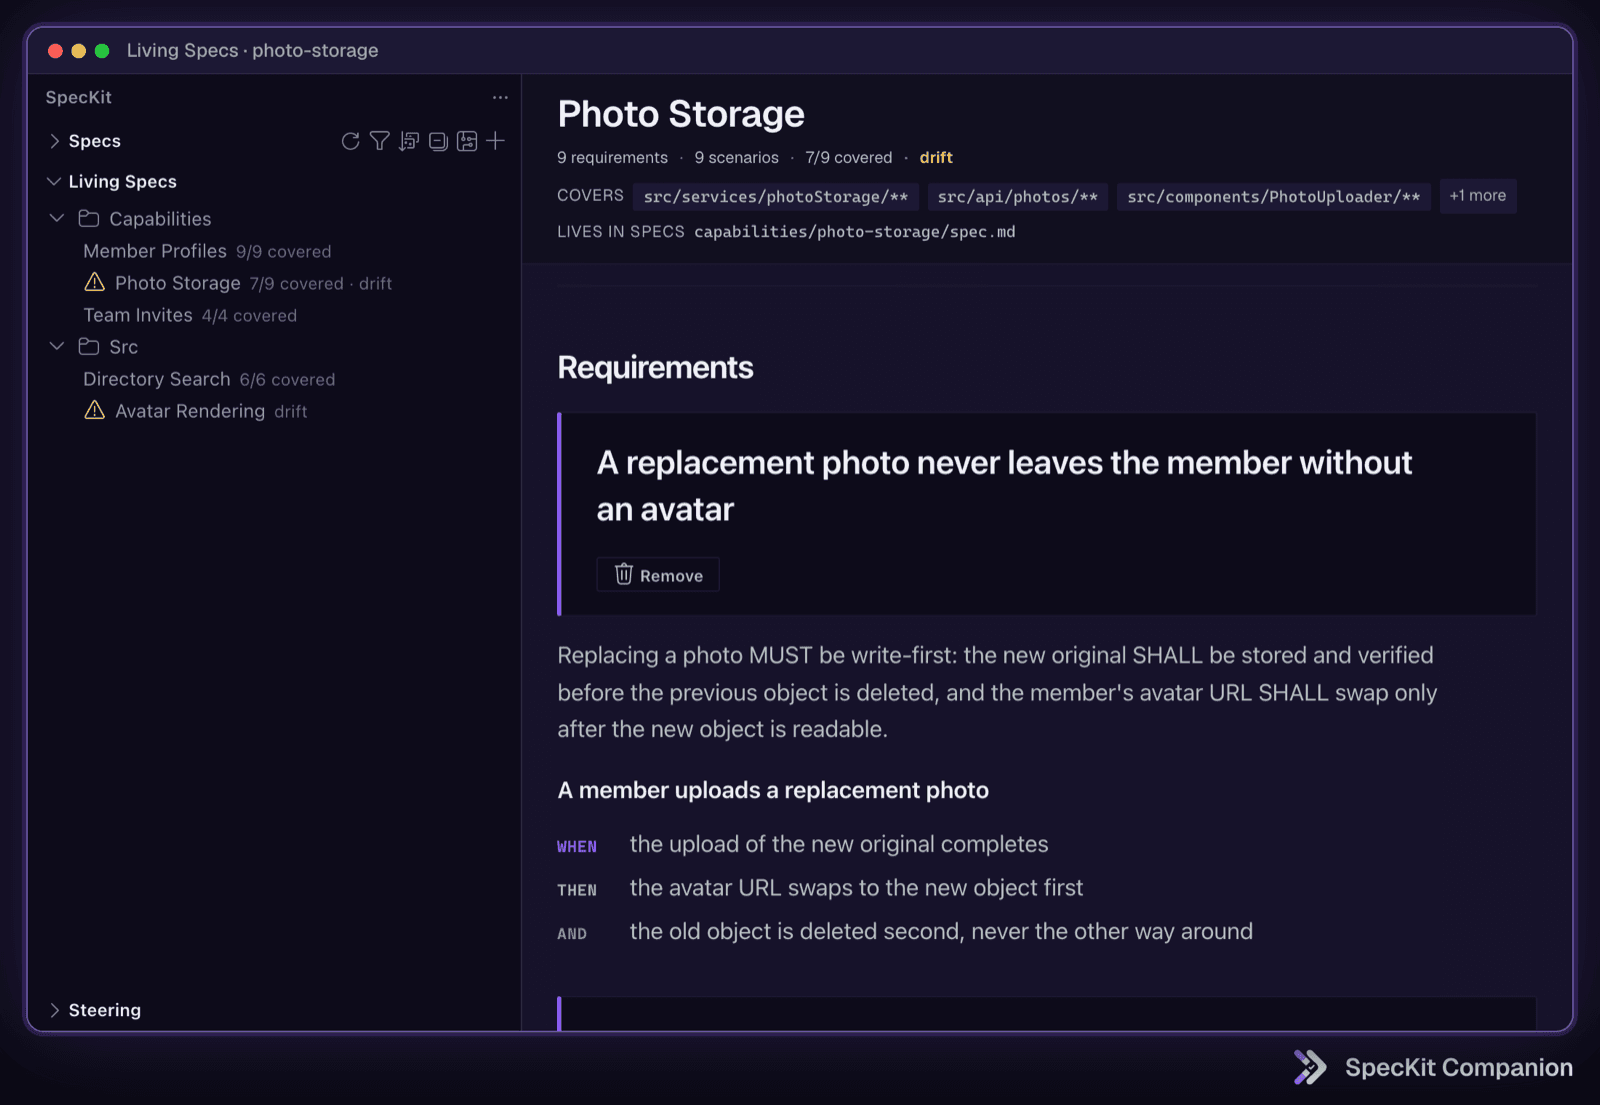
A living spec holds what the capability must do, as requirements with scenarios, plus the paths it covers. When a feature run touches that area, the spec is loaded before the agent reads code, and when the feature ships, what changed is folded back into it. The feature spec stays as the record of the run, and the living spec is the record of what is true.
Each requirement is a card, and its left edge tells you where it stands: confirmed, adopted and waiting for you to confirm it, or drifted because the code changed. Each capability shows its test coverage, and the drift flag appears the moment its source files change without the spec following. Comments and Refine work here the same way they do on a feature spec. Open any source file and the status bar says how many living specs describe it, one click from the requirement. That's the answer to the question a folder of feature specs can't answer: is this still true?
See the pipeline your project runs
Spec-driven development only works for a team if the workflow fits the team. Yours might want a security review after the plan, a different task template, or no checklist at all. When the pipeline can't bend, people route around it, and then the specs stop meaning anything. So Companion lets you change the pipeline, and the Pipeline Builder is where you see what you changed.
The steps are columns in run order. Inside each step you see its phases, the nodes in them, and the hooks your project attached before or after.
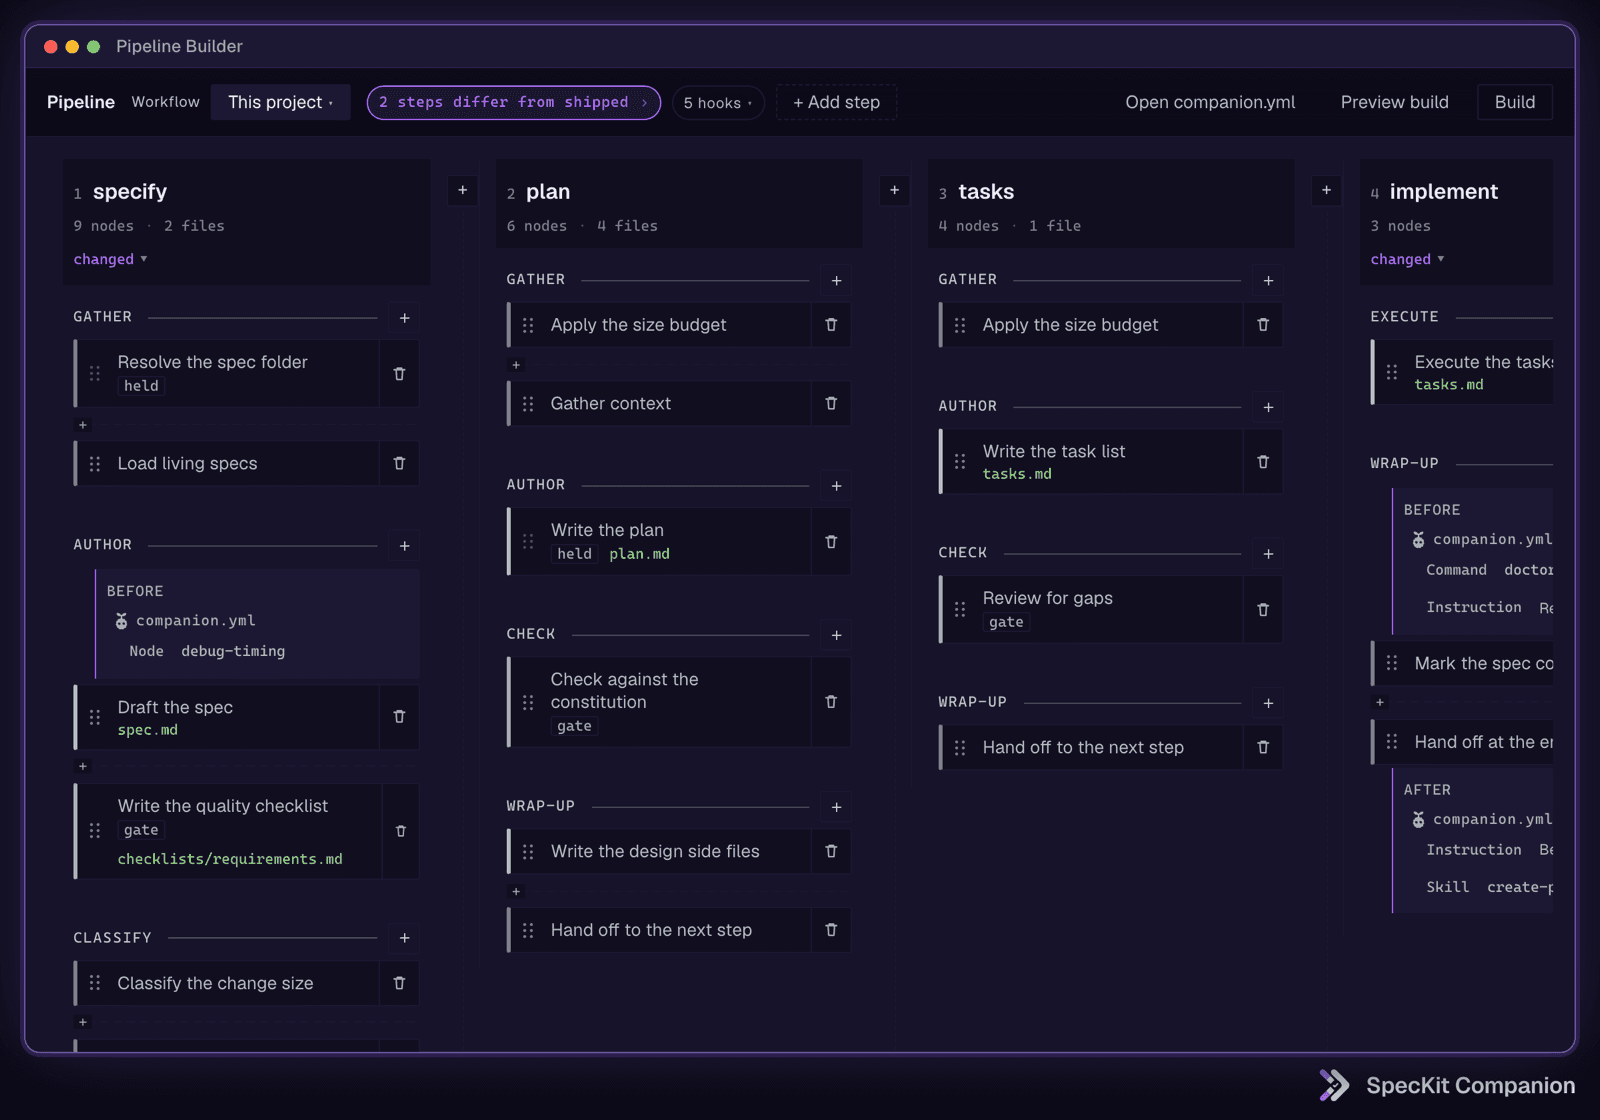
Anything your project changed carries the same color: a hook you added, a node you rewrote, a template section you replaced. Nothing else gets that color, so when someone asks what your team does differently, you can answer by looking. You can build from the same panel too, and if companion.yml is newer than the commands built from it, the header tells you.
What changes in the run itself
Companion isn't only a better way to look at the files. It also adds new ways to run Spec Kit, so the workflow fits how you actually work. Each of these gets its own piece:
- Fast mode reads the size of a change and folds the pipeline for small ones, so a renamed button doesn't get the full ceremony.
- Auto mode runs specify to implement without stopping, which is how I plan several features and review them together.
- Living specs, adopted on a repo you already have, with drift detection and sync.
- Custom workflows: your own steps, hooks, and node order, from one file. The earlier versions of that idea are in Build Your Own SDD Workflow and Custom Workflows in SpecKit Companion.
Try it
- Install the VS Code extension from the Marketplace, and the spec-kit extension with the command above.
- Open a repo with a
.specifyfolder. - Read the Overview before anything else.
Docs and install links are at speckit-companion.dev.
Next up: how I plan several features at once, run them in auto mode, and review the whole batch from the sidebar.


